Wednesday 11 January 2023

DJANGO APPLICATION FOR GEOSPATIAL DATA COLLECTION

 Introduction


This paper presents a web application that was developed in the Python programming language using the Django web framework and the Django geographic module GeoDjango. The "nnm" application is a web application that can be used in the electricity distribution company to collect the necessary data about the low-voltage network.

This paper is divided into three parts. The first part will describe the technology used in the development of the application, followed by a description of the database itself, Admin, Frontend, and finally a conclusion describing the application, the possibilities of embedding.

HTML

HTML (HyperText Markup Language) is the code that web browsers, such as Chrome, Firefox or Safari, use to display a website or application to users.

HTML stands for HyperText Markup Language. HyperText means that it is a type of text that supports hyperlinks between pages. Markup means we've taken a document and marked it up with code to, in this case, tell the browser how to interpret the page.

CSS (Cascading Style Sheets) is a language used to describe the layout and formatting of a web application written in a markup language such as HTML. CSS is the foundational technology of the World Wide Web, along with HTML and JavaScript. CSS is designed to allow separation of presentation and content, including layout, colors, and fonts. CSS is a completely independent language, separate from HTML, but practically cannot do without it. It can be said that HTML and CSS cannot do without each other. While HTML document structures create page elements, CSS styles and edits these same elements to give them the desired shape and function. CSS design can often be said to be an application. That is not completely true, it is not far from the truth. Without CSS, modern websites would look very plain and could not be used adequately.


JavaScript

JavaScript is a scripting programming language for dynamically programming web pages to make them as interactive as possible. It is also executed in the Internet browser of the user browsing the pages. Its syntax resembles the programming language C and Java, but it is considered a functional programming language.

JavaScript allows direct manipulation of web page elements, thus making them more interactive. Nowadays, JavaScript is more and more important because there are a large number of existing libraries that are accessed with that language. JavaScript libraries facilitate the work itself and speed up programming due to many ready-made functions that are often used in the development of web applications.


PostgreSQL

PostgreSQL is an open-source object-relational database system. It uses SQL as a language for capturing data, and can also use most scripting programming languages such as Perl, Python, and Ruby. The already built-in language is PL/pgSQL which is similar to the procedural language PL/SQL used in Oracle databases.

It contains almost all the possibilities from the SQL:2008 standard and is therefore the most complete open-source relational database. PostgreSQL does not include support for managing spatial data, but the PostGIS add-on adds that capability.

PostGIS

PostGIS is a plugin that adds the ability to manage spatial data to the PostgreSQL database and can then be considered a spatial database. PostGIS functions comply with the OpenGIS specification "Simple Features Specification for SQL".

When PostGIS is installed in the PostgreSQL database tables, a "geometry" type field can be added, which can contain points, lines, polygons, or a collection of the specified objects. In order for it all to make sense, it is necessary to use PostGIS functions to manage that data. This is achieved by SQL queries that contain functions for manipulating geometric fields. There are several types of such functions such as:

- geometry constructors (for creating geometric fields),

- functions for retrieving properties or individual elements of geometric fields,

- functions for editing geometric fields,

- functions for converting geometric fields into some of the output formats (WKB, WKT,

GML, GeoJSON, KML, SVG, GeoHash) and

- Functions for measurement and relationships between geometric fields.


Python

The Python standard library is well adapted to writing web applications, but it does not include modules for direct communication with databases, but provides an API (Application programming interface) with which such modules can be created. Web applications most often use databases, so such modules outside the standard library are already available for all important databases (Oracle, MSSQL, PostgreSQL, MySQL).

One such module is psycopg2 for communication with the PostgreSQL database. It uses all the capabilities of the Python DB API and can be safely used in a multi-tree environment (trees can share the same connection to the database).

Python is a powerful, flexible programming language that can be used to develop web applications, create games, and more. Python is a high-level language that is very easy to read and write.

Python is also an interpreted language - which means that it is interpreted when the source "code" is directly executed with the help of an interpreter without the need to compile or translate it into an executable form.

Python is an Object Oriented language, users are allowed to manipulate data structures called objects, in order to write a program and execute a command at the end. The Python programming language was created in the early nineties of the last century. Its author is Guido van Rossum. He was employed at the Stiching Mathematish Centrum (CWI) in the Netherlands at the time of the language's creation.

Given the very name of the Python language, the author let us know that programming can be as fun as the series of the same name, after which the program was named "Monty Python's Flying Circus", or in English "Monty Python's Flying Circus".

Linux is the right environment for Python, however it can also be used on a Windows system, but its environment is simply made to adapt to Linux operating systems, which is good, considering the ways of programming and the speed of command execution.


Gdal

GDAL (Geospatial Data Abstraction Library) needs to be installed $ sudo apt install gdal-bin


GeoDjango

GeoDjango is a built-in application that is included as a contrib module in Django. It is actually a complete framework that can be used separately from Django. It provides a set of tools for building GIS web applications. GeoDjango also provides Python bindings for popular spatial libraries such as geos, gdal and can be used separately without Django in any Python application or directly in the shell. GeoDjango integrates very well with the Django framework and provides a set of geometry fields defined by the Open Geospatial Consortium (OGS), which can be used to map different types of geometries in geospatial databases:

- GeometryField, is the base class for all geometry fields in GeoDjang,

- PointField, is used to store GEOS point objects,

- PolygonField, is used to store GEOS polygon objects.

To be able to work with GeoDjang, two things are needed:

- spatial database and - geospatial library.

A spatial database is a database that is optimized for storing and querying data representing objects defined in geometric space. In order to fully enable all functions of GeoDjang, the following geospatial open source libraries were installed; geos, gdal, proj.4, psycopg2.

GeoDjango is a plugin for the Django environment that adds the ability to manage spatial data. The development of GeoDjang began in the fall of 2006 independently of Django, and in 2008 it became part of the Django environment. The GeoDjango plugin enables quick and easy creation of web applications that use spatial data. In that case, a spatial database must be used, and GeoDjango supports the following:

- PostgreSQL with PostGIS plugin

- MySQL

- Oracle

- SQLite with SpatialLite plugin

To create a GeoDjango application, it is necessary to choose the operating system on which the server software will be executed. This paper uses the Ubuntu distribution of the GNU/Linux operating system version 22.04.

The PostgreSQL spatial database with Postgis and psycopg2 extension was used during the creation of this project. The tool used Visual Studio Code as the development environment. Also, when creating this project, web technologies html, css and JavaScript were used.

The first version of the Ubuntu distribution was created in 2004, based on the Debian distribution. With

RedHat and Debian, the Ubuntu distribution is often used for web application use due to its simple operating system and easy installation and configuration of server software.

In a test environment, a Django application can run its test web software, and as a database it can use an SQlite database consisting of a file that the Django application accesses using the built-in function library. such a combination is not suitable for a production environment due to the poor performance of the embedded web software and the lack of spatial data management functions in the SQLite database. For the production environment, it is necessary to choose an independent web server and spatial database. The web server used in this work is Apache with the mod_wsgi plugin, and the spatial database is PostgreSQL with the PostGIS plugin.


Ubuntu is a distribution of the GNU/Linux operating system. Based on the Debian distribution,

Ubuntu pays the most attention to ease of use, freedom from all restrictions, regular release of new releases (every 6 months) and ease of installation. Ubuntu is sponsored by South African businessman Mark Shuttleworth's private enterprise, Canonical. The name of the distribution comes from the African ideology of ubuntu (roughly: "humanity towards others").


Django

Django is a set of tools and a foundation for creating web applications in the Python programming language. He is alone

Django is written in Python and was created to speed up and simplify the programming of web applications as much as possible. It contains ready-made tools for standard development procedures such as:

- object-relational data models, - automatic browser for administration, - elegant URL display.


Web application programming often involves repeating the same tasks over and over again. Such tasks are:

- creating an administrative browser,

- user authentication,

- user rights,

- creation of data entry forms, - validation of entered data and - internationalization of web applications.


In other programming languages and environments, such tasks are painstaking work. U

In the Django environment, the listed procedures are simplified and boil down to writing a few lines of Python code. The object-relational data model avoids writing the SQL queries that Django automatically generates.

With more complex web applications, it is necessary to isolate the logic of the application from the display part of the application. Django uses the MVC (model-view-controller) architecture where the model represents the data model in the database, the view represents the display part of the application (what the end user sees), while the controller is responsible for the logic of the application itself and connecting the model and reviews.

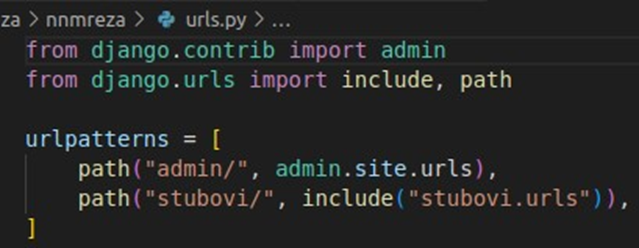
Django uses different names for MVC elements, which is a bit confusing. The Django view actually represents the controller, and the template represents the view from MVC, so the implementation of MVC in Django can be called MTV (model-template-view). When a user types the address of a Django application into their Internet browser, that address is first accepted by the URL forwarding module. This module consists of regular expressions according to which the view to be activated is selected. The view communicates with models that are responsible for communicating with the database. The model returns data from the database to the view, which is then sent to the template (usually HTML). The template generates HTML code according to the received data and sends it back to the user. If cache is used, or if data from the database is not needed, some of these steps can be bypassed.

Application creation in Django and installation

The application was developed in the Visual Studio Code editor, primarily because of the many extensions it offers, but it is also possible to use other program editors such as Sublime Text or Notepad ++.

Creating the application starts with the creation of the project, the terminal offered by Visual Studio Code is used for commands:

This command creates a new directory where the manage.py and nnmreza files are created. The nnmreza file is the main folder whose files are treated as a Python package, and manage.py is the file used in working with the terminal, for starting the server, migrating data to the database.
To create an application within the nnmreza, which will be called "pillars", it is first necessary to position it within the project, i.e. nnmreze and then the startapp command.

Application setup
After the stubs application is created, it needs to be added to the list of installed applications in settings.py located in the main nnmrez directory. Settings.py is a core file or
"core" in the Django project. It contains everything needed to configure the project in creating the application, from database settings, logging records, where to find static files, API keys if working with an external api and many other settings.
Elements in the list of installed applications are written in quotes as a string and separated by a comma.
 
View.py or "View"
In the Django file view.py, functions are defined that retrieve data from the database, and then pass it to the forms that will be displayed to the user. For each form you need to write a function.
Template
A template or "view" represents a folder. A map named template is created in the application and an html file (map.html) is created in it. In that file, data is displayed depending on the functions we defined in view.py. Forms cannot use standard typing of commands in
Python, because they are still html files, but that's why Django has its own language that enables it.
Adding javaScript and CSS files
The next thing to do to create the application is to add the "static" folder. The folder can be created in the Visual Studio Code browser by selecting the icon or in the terminal with the command:

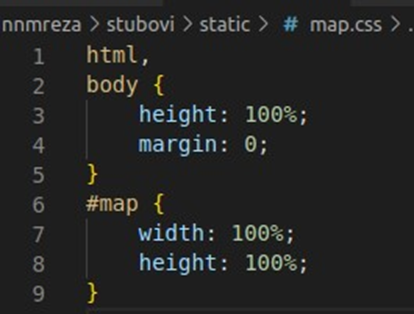
U kreirani folder „static“ koji se nalazi u nasoj aplikaciji stubovi kreiramo fajlove map.css i map.js

Adding a new URL
The next thing that is needed is to create a new url.py in the pillars application, which normally does not come with a formed url.py and needs to be created every time.
In urls.py it can be seen that a link was created from views.py with the created class "StuboviMapView" and based on it the path "map/" was created, which is entered in the browser.
Modification of urls.py in nnmreza
In the main nnmrez folder, the urls.py file comes with the admin path already created. For the needs of the application and its launch in the browser, in this example we add the include module and create the link "pillars" or we can write something else.
 
Creating a spatial database
To import a model created for a database, you need to create a database in postgresql. We can do this in two ways through the terminal in psql or by installing a gui for postgresql called pgAdmin4. In it, the base is created in an easier and faster way, and the gui allows visibility and easier manipulation.
After the database has been created, it is necessary to create a postgis extension that will allow us to store geometric data. If the extension is properly formed, the spatial_ref_sys table will be formed in the database.
Changing data in settings.py for base
After creating the database in postgresql and the postgis extension, it is necessary to modify the data in settings.py. Settings.py is located in the main nnmnet project.
By default, "ENGINE" comes with Django's sqlite3 and the spatialite extension, which we change to postgis, and we enter the data according to the principle that was created in the database. According to user experience, for geoprojects and web applications with a "geo" sign, it is recommended to use postgresql, especially because of the pgadmin it offers.
 
Importing GeoDjango
To activate GeoDjang and all its features, it is necessary to modify it
INSTALLED_APPS in nnmrezi/settings.py by adding django.contrib.gis
Model.py
In a Django application, a model represents a table in a database. Models in Django are defined as classes, and they represent data in the database, i.e. each class represents a table in the database itself.
Variables represent columns and are used to define relationships. The model for the database that we will create in postgresql:
The 'stub' class contains the attributes 'stubovi', 'lokacija', 'grad', 'konzola' and 'provodnik'. All fields except the location are text type and maximum length is 255 characters, while the location model stores points or "point". Point objects are instantiated using arguments representing the coordinates of the point. Django with its tool for automatic synchronization with the database creates a table in the database with the specified attributes, and this structure does not need to be adjusted additionally.
Data migration
After the model has been created and the database with the postgis extension has been set up and the ussettings.py connection has been set up, the data from the model must be migrated with the command
By default, 10 tables are created in the database after the command. In them we can see administrations, data for migrations, logging, etc.
The next command to create a new table in which we store data from the application is:
Admin.py
To import new pillars, it is necessary to add the pillar admin in the application stubovi/admin.py
GeoDjango contains add-ons for the administration panel that allow the creation and modification of geometric shapes. Basic is a GeoAdmin plugin that uses the background
OpenLayers maps. For more detailed backgrounds, OSMGeoAdmin can be used, which uses Open Street Map layers. The activation and setting itself can be seen in the attachment.

Login to Admin
To start the admin, you need to create users

When creating a superuser, it is necessary to enter information about the name, email, which is optional, and password. With these data, you log into the Django admin area. After creating the necessary data, we use the command to start the default server http://127.0.0.1:8000/. If our default server is busy, we can also use e.g. 9000, we just have to enter in the command which server we want.

After logging in, the Django admin area is displayed. In order to facilitate the manipulation of the model and to facilitate the users of the application, such as editors, administrators who usually do not have any programming experience, the practice of creating the administrative part of the application is often used.
This part serves to manage the application model through the user interface, without using code. In the example of this application, this would mean that in the pillars application, the administrator can log in to it, fill in data, add users, delete data and edit it. There is also a Django allauth module which is an integrated set of Django applications dealing with account authentication, registration.

The data entered in the columns application is recorded in the postgresql database


The data is displayed on the map with a marker defined by the leaflet, and the base layer or base is from OpenStreetmap, with a popup that calls the column name in the database.


This paper describes how to create a web application using Django with GeoDjang. It turned out that the application is quite flexible and that it is easy to add new features that have been omitted in this work due to the focus on Django's geo features. The possibilities that arise are the expansion of the "pillars" application, which should contain Bootstrap, a photo, more bases and data that needs to be entered. Additional classes in models to form additional tables of substations, their coordinates and attributive data with addresses, photos.
Potential users of this application are, in addition to distribution companies, cable operators who also use a network of towers for data transmission.


Tuesday 10 January 2023

RECORDING OF UNDERGROUND INFRASTRUCTURE USING LIDAR TECHNOLOGIES AND UAVs

The infrastructure for the distribution of electricity represents an important segment of the state infrastructure. The main purpose of the electricity distribution network of Elektrokrajina is to supply consumers with electricity.

It is necessary to find an adequate data collection method that enables accurate output data in a short period of time for the performed works on the infrastructure of underground power lines and the exact locations of substations.

This paper presents the methodology of mapping the preparatory works for the laying of power lines with the built substation STS Česma 9, using UAV and the double grid method provided by the PIX4D Capture application and the LiDAR technology owned by the Apple iPhone device. These data can be used in many cases, but mainly for the management and planning of the electrical distribution infrastructure.

The study location is located in Banja Luka in the Česma settlement, the existing STS Česma Vukoje is the initial connection point of the subject cable line. As already mentioned, the subject STS Česma 9 is connected to the electrical power grid with an underground cable type XHE 49-A 3x (1x150).


The paper consists of several parts:

The first part provides data on the company Elektrokrajina itself and describes the targeted objects to which this paper refers.

The second part refers to work with UAVs, the use and application of unmanned aerial vehicles in GIS, then the detailed procedure of using a DJI mavic Pro drone equipped with a 4K camera in the creation of a 3D model is described. Digital 3D terrain and height model, creation of digital orthophoto display, and analysis of collected data with the Structure of Motion algorithm.

The third part refers to the explanation of the functioning of the LiDAR technology itself, and the software solutions that support the processing of data obtained with this technology.


The fourth part defines the results, time spent on data collection, processing and analysis. Using C2C distance in CloudCompare software to compare recorded data with UAV, LiDAR and field data.

1.1 Data on Elektrokrajina
Namely, the company Elektrokrajina a.d. is the largest electricity distribution company within the MH "Elektroprivreda Republika Srpska" parent company a.d. Trebinje (ERS). Electricity supplies 47% of consumption in Republika Srpska. The main activity is the distribution of electricity and power facilities. In addition, the company performs the design of power facilities as well as their construction and maintenance. Elektrokrajina is organized into 10 field units, and all functions of the company are unified at the level of the Directorate of the company, which is located in Banja Luka. Elektrokrajina owns 4,354 transformer stations and over 261,434 consumers, and the length of the network is 23,500 km, which in itself, due to the amount of data, represents a challenge for data collection and monitoring, which will be presented in this paper. 1.2 Objects of observation Electric power cable line The usual distribution of electricity is divided into an underground and an above-ground network, with the underground prevailing in urban areas and the above-ground in rural areas. By applying self-supporting cable bundles (SKS, universal cable), this picture changes with a new and economically justified way of distribution. The novelty is that the same cable can be used along the entire route, and the installation method that best suits a particular section is chosen. On the same route, we can run the cable above ground, lay it in the ground or even in water, and all this according to the needs of the route, that is, the requirements of the project. This means that the most economically advantageous solution can also be chosen. 3 It is recommended to lay power cables directly in the ground, in a cable trench whose dimensions depend on the specified cable voltage, the type of soil, as well as the number of cables laid in the same trench. The normal depth of the trench in which the cable is laid is 1.1 m for 35 kV cables and 0.7 m to 0.8 m for 1 kV, 10 kV and 20 kV cables.

Figure 2. cable construction


Due to their construction, cable lines can be laid underground, because only they are protected from water penetration by the cable jacket. Each of these methods requires special protection measures against mechanical influences.

Laying cables in populated areas is also difficult due to the fact that it is necessary to ensure the smooth flow of traffic and the movement of pedestrians. We only lay cables at temperatures above 5°C.

Cable ducts are often dug by hand in cities, but where possible, mechanization is used, i.e. machines for digging cable ducts.

Pole substations

Pole transformer stations (STS) are intended for supplying electricity to suburban settlements, rural households, weekend settlements, and industrial facilities. the basic element of every pole transformer station is the power transformer (ET).


STS is a free-standing pole transformer station that is formed from prefabricated elements that enable quick and easy assembly, and are made of materials that do not require special maintenance. The pillar and other STS equipment should be of such dimensions and weight that they do not require larger truck cranes and special vehicles for transport and installation.

The STS pillar should meet the requirements of technical regulations for the construction of overhead power lines, the requirements of technical recommendations.

The foundation of the STS column is concrete. It is recommended to use prefabricated foundations, but it is also allowed to make foundations on site.


If the stem of the STS pole is metal, it should consist of a maximum of three parts assembled on site. The length of the STS pole should be such that the requirements regarding permitted safety heights and distances are met at the installation site.

2. UAV with Structure of Motion algorithm In recent years, drones (also known as UAVs and unmanned aerial vehicles) and related technologies have developed rapidly and are expected to play an active role in many fields. A drone can have rotary wings or fixed wings. depending on the model, the UAV may have not only one RGB camera but also a laser scanner and multispectral cameras. The user can choose from different models based on their needs. The advantages of UAV are high resolution and high data density, flexible work performance, high frequency observation, low cost and safety.

The SfM process (Figure 5) is an advanced photogrammetric method of creating three-dimensional geometry

static scenes using a moving camera. This approach allows the reconstruction of a three-dimensional geometry or structure starting from a set of two-dimensional images of a scene or movement. Unlike traditional photogrammetric methods that reconstruct the 3D coordinates of control points on objects, this is not necessary with the Structure from Motion method. The SFM method simultaneously and automatically finds solutions for camera positions, after which it creates a three-dimensional geometry of the scene in an iterative process of comparing a series of images and searching for common characteristics. The condition for this is a large number of redundant measurements, i.e. photo and multiple overlap between them. Also, Structure from Motion is a low-budget measurement method, as it does not require expensive instruments. Measurements can be completed with any type of digital camera, from smaller digital cameras, smartphone cameras, or drone-equipped cameras. The first stages are the discovery of features in each image, their characterization through descriptors and the final matching of established correspondences. It is important to note that the geometry reconstruction does not require any a priori assumption, such as the use of ground control points (GCP), since the well-known collinearity equations can be solved at any arbitrary scale. The next advantage of SfM lies in the simultaneous estimation of the external and internal orientation of the camera, performing the so-called self-calibration. This is particularly useful whenever an uncalibrated camera is used to obtain aerial images.

The solution is the recent availability of lightweight and compact digital cameras along with the continued development of newer and more powerful algorithms in computer vision. In addition, the use of small unmanned aerial vehicles has revolutionized classical aerial photogrammetry, leading to new ones

6

digital photogrammetry based on the structure-from-motion (SfM) approach that provides excellent results in terms of spatial resolution at a low cost.

The positive side of this kind of modeling when performing construction works is the simplicity of data collection. Great attention should be paid to the method of taking photos and the georeferencing of the photos taken. Simplicity is reflected in the fact that the software, if there are no obstacles, very quickly and easily creates a model of the observed recording object. The negative side of modeling when performing earthworks is disturbing the texture of the observed object's material. If the surface of the observed object is smooth and continuous, the software creates a 3D model simply and quickly. However, if it is a material that has certain unevenness on the surface, as in the case of excavation for the purpose of laying an electric power cable line, the modeling becomes more complex and potentially has greater deviations.

7

Methodologically, the process of obtaining the output data of the excavated trench for the purpose of laying the cable line consists of two phases:

1. Phase - data collection in the field

2. Phase – data processing on the computer.

Data collection in the field is divided into several steps.

The first step is to review the terrain and conditions for filming. In it, we collect all the necessary information with which we later decide from which position we shoot, the shooting height with regard to the geometry, the size and position of the observed space that we have to record, and the weather conditions during the recording itself. It is necessary to check the drone itself from the calibration, which is important, in order to get the most accurate data. before starting to use the drone with different calibrations of the tracking system for the number of satellites in orbit. The number of satellites that will be connected to the aircraft is mostly influenced by the location where the drone will be used. The average number of satellites that can be obtained is 20. A large number of satellites enables the aircraft to fly precisely and to have greater control over the drone itself. Even before the start, it is necessary to charge the batteries, connect the memory card.

During recording, due to speed and autofocus, there is a possibility that a certain number of photos are out of focus, which is why it is possible to make an error during gimbal calibration, and it is necessary to recalibrate the camera gimbal. Focus can also be affected by moving objects that can be found around the subject, the movement of branches with leaves on trees or the possibility of birds passing by.

The second step is the collection of images, that is, the recording of excavations and poles with substations. It is important that the photos overlap each other and that the object of observation is captured from all angles. For better results, you should try to record the objects from an equal distance from the camera to the object and perform the recording in cloudy weather so that the recording objects are equally illuminated.

The next step is to detect common points in Agisoft Metashape. The program detects two-dimensional points on each unique image, so that later photos can be connected through them. The higher the image resolution and the more varied the texture, the more common points will be identified, resulting in a higher quality point cloud.

After detecting common points, a basic point cloud (sparse point cloud) is created. Or a rough point cloud, taking into account the detected common features, a three-dimensional point cloud is created with relative coordinates of objects and camera positions.

Programs for applying the Structure from Motion method use different algorithms for automatically searching for common points and creating a 3D model in the form of points (point cloud). Algorithms work on the principle of searching for common structures between a set of photos, and based on that they provide an initial assumption of the camera position and the coordinates of the objects' points. Through an iterative process, using a certain method, such as the method of least squares, point coordinates and camera positions are redefined to the optimal solution and a three-dimensional point cloud is created. Although SfM software differs from one another in the methods used, the basic workflow remains the same.

3. AGISOFT METASHAPE SOFTWARE

The second phase related to data processing on the computer is the use of Agisoft Metashape software in order to create a 3D data model.

Agisoft Metashape software can load a series of digital images and using photogrammetry will produce a point cloud dataset. Metashape automatically finds thousands of shared discrete object points between images. Each characteristic point located in the image is called a keypoint. When 2 keypoints or keypoint-s on two different images are found to be the same, they become matching keypoints. Each group of exactly aligned key points is generated into a single 3D point. When there is a large overlap between 2 images, the captured common area is larger and more keypoints can be matched together. Metashape offers the option of importing videos recorded by a UAV and converting the video into frames, after which it is possible to process the data in 3D.

9

3.1 Photogrammetry

Simply put, photogrammetry is a method of measuring distances using photographs. The photos are processed using software to generate accurate and realistic models of the world.

3D models offer a variety of possibilities, from construction planning and ongoing project management to marketing materials. The number of photos required for effective photogrammetry can range from tens to several thousand. Everything depends on the size of the site, the detail and accuracy we want to achieve.

The main advantage of photogrammetry is affordability, the rise of drone technology and mapping software has simplified the work and made the accuracy of maps and 3D models accessible to any organization with a decent camera drone or mobile device. Geometrical reconstruction of the measured object is the main goal of photogrammetry.


Imaging methods based on photogrammetry have several disadvantages. The first is that the accuracy of your maps and models is highly dependent on the quality of your drone or mobile device camera. Another challenge we face is the weather or light conditions themselves. Darkness, cloudiness, dust and more can negatively affect the quality of the recording results. In the data processing itself, only what is recorded and clearly visible can be measured. This means that photos with limited visibility due to vegetation, shadows or time of day will produce fewer points and less accurate models or maps.
Photogrammetry includes methods of image measurement and interpretation to provide the shape and location of an object from one or more photographs of the captured object. The real possibilities of photogrammetry come from the ability to access the information stored in photographs, which represent a growing component in the digital reconstruction performed today.
The history of photogrammetry dates back to the late 1830s, when the process was first recognized as useful in measuring building facades for architectural purposes and military mapping. The term photogrammetry itself was first used by Mezdenbauer, a German architect and Kersten, a German geographer, and the term first appeared in print in 1867.

4. 3D SCANNING METHOD
 
Processing of 3D scans involves a lot of steps, which are shown in this section, which goes through the concept of recording, uploading data, downloading data and processing scanned data in softwares and applications.
The location of the scanning of works that include the laying of underground cable lines is in Banja Luka, Prvog Krajiško Bataljona street. The shooting location is outdoors, strong lighting contrast, reflective nature, several materials (asphalt, plastic, earth) that have a low gloss finish and matte finish concrete will provide a good environment for scanning works. It should be noted that glass has highly reflective properties and is usually eliminated from the point cloud.
Also water and chrome prevent proper scanning. In ideal conditions, the scanning accuracy is 95%, it all depends on the technique and the size of the recording. For more accurate data, it is better to split larger and more complex recordings into several batches. Scanning should be done slowly and methodically to avoid the so-called drift and loss of position and signal of the device itself.
The recommendation for the recording itself in outdoor conditions is 5x5 meters in a block or on a scale of 25kV meters, however, new iPhone devices have a large memory so everything depends on the device and the recording can be increased.
 
 
4.1 IPHONE DEVICE
Apple Iphone 13 Pro Max is a device that is able to document data from the site of construction works in several ways and methods. One of the most important and most accurate ways is the LiDAR sensor. The LiDAR sensor data acquisition method is used to analyze real-world objects or environments to collect information about their shape, dimensions, and color. The collected data can then be used to create digital three-dimensional point clouds for analysis.

In the blog, the LiDAR application 3D Scanner App was tested, the application is available for download from the Apple App Store. The software used in further processing is Cloud Compare. In this work, the additional device viDoc was not used, which enables additional precision of up to 5 cm. The viDoc RTK Rover was created by Pix4D, a Swiss company that develops photogrammetry software for drone mapping and 3D modeling. The viDoc RTK Rover is a handheld terrestrial photogrammetry solution, designed to facilitate mapping and imaging using 3D scanning.
Pix4D developed viDoc to facilitate complex workflows that use expensive, heavy and high-tech laser scanners. As a portable and lightweight solution, the RTK can be mounted on a mobile device and connected to Pix4dcatch via Bluetooth.
The iPhone 13 Pro Max represents a new device concept that combines the ability to make calls, search the Internet, control a drone, take high-resolution photos in low light and scan with LiDAR, which has become a reality where it seemed impossible a few years ago. Apple made it all possible in one device a few years ago, it placed powerful technology in one device (Ipad or iPhone).
Laser scanning inspections can be of great use in Electric Power Companies, Telecommunications, Waterworks, Environmental Protection Agencies, Forestry and so on. Collecting data when laying underground power lines is a big problem due to the volume of work involved in recording and collecting accurate data. Currently, the collection of three-dimensional point cloud data would be reserved for government projects only, as budgets for equipment and training are high. Whereas now, smaller projects have the ability to collect very useful 3D data in more detail. It can be said that collection becomes commonplace if access to technology is provided to users with adequate training in the use of devices and applications. One must start with the assumption that the device itself cannot deliver the exact data and results that the data requesters expect, without knowing how to obtain the data itself.
6. LiDAR
  LiDAR stands for Light Detection and Ranging, light detection and distance measurement.
LiDAR sensors work by emitting light pulses and measuring the time it takes for them to bounce off the ground, along with the intensity at which they do so. This technology is for obtaining and processing information about distant objects using active systems that use the phenomena of light reflection and scattering in transparent and semi-transparent media. LiDAR is a device similar to radar, so its application is observation and detection, but instead of radio waves, as in radar, it uses light, which in the vast majority of cases is created by a laser. The term LiDAR is often used interchangeably with LaDAR, which stands for laser detection and ranging.
The LiDAR sensor is only one part of a complex process. To collect data to create a point cloud that accurately reflects the terrain and its topography, LiDAR incorporates other high-accuracy systems, satellite positioning and an inertial measurement unit (IMU).
LiDAR has been the subject of research for many decades since its inception in the early 1960s. However, interest in it has grown noticeably since the beginning of this century, primarily thanks to technological progress.
5.1. Advantages of LiDAR
The most cited positive side of using LiDAR for 3D modeling is the accuracy of the technology. LiDAR enables recording of small diameter details. What is important for e.g. power companies in recording power cables. Thanks to the high-density point sampling and direct measurement approach, LiDAR can be used to precisely map the cable network. LiDAR provides a fascinating dataset, the finest detail on the Earth's surface. It provides a much more detailed and nuanced picture than DTED (Digital Terrain Elevation Data) technology, which provides information about the height of the earth's surface at certain points.
5.2. How LiDAR works
LiDAR works by illuminating a target with light. LiDAR can use light in the visible, ultraviolet, or near-infrared range. The principle of lidar operation is simple. Object
(surface) is illuminated with a short light pulse, the time after which the signal returns to the source is measured. LiDAR launches fast short pulses of laser radiation at an object or surface with a frequency of up to 150,000 pulses per second. The sensor on the device measures the time between the transmission of the light pulse and its reflection, assuming a constant speed of light of 299792 km/s. By measuring this time interval, it is possible to calculate the distance between the LiDAR and a separate part of the object and therefore create an image of the object based on its position in relation to the LiDAR.
6. CLOUDCOMPARE SOFTWARE
 
CloudCompare is a software for processing 3D point clouds, in it a comparison will be made with a dense cloud of points captured by the LiDAR sensor on the iPhone 13 Pro Max, while Agisoft Metashape will process photos taken with a UAV.
Through updates, CloudCompare has become a generic point cloud processing software, including many advanced algorithms such as: Logging, Resampling, Color Manipulation, Static Computing, Sensor Management, Visualization Enhancement and more.
This program was created in cooperation of Telecom ParisTech with the research and development department of EDF. The CloudCompare project began in 2003 with Daniel Girardeau-Montaut's Ph.D. on change detection in 3D geometric data. At the time, its main purpose was to quickly detect changes in high-density 3D point clouds obtained by laser scanners at industrial facilities or construction sites. It later evolved into more advanced 3D data processing software. It is now an independent open source project and free software.
The data uploaded to CloudCompare can be in .E57 or .XYZ format exported from the 3D Scanner App to the OneDrive cloud services where the account was previously created. The Pix4D Capture application is used for automated control and recording of terrain with the help of UAVe. In this software, it is possible to select existing flight patterns or create a flight plan independently with the help of GCP points, determine the frequency of photography, flight height and overlap percentage, and let the automatic system take full control of the aircraft. There is also a safeguard, so that at any moment the remote pilot can take full control of the drone. During photography, the Pix4D Capture mobile application reads the global position and writes it inside each photo. The application was installed on a mobile device, and the first flight was the basis for creating an orthophoto plan. A single recording grid or "grid mission" is sufficient to create an orthophoto plan, while a "double grid mission" was used to create a 3D model of the area of interest.
Photos were taken orthogonally to the earth's surface with an 80% overlap, at two-second intervals.
  The shooting in the field was done in cloudy weather, which enabled better quality data acquisition, with minimal shadows and with even lighting of the recording object in question. After the preliminary analysis of the channel and terrain, it is necessary to make a recording plan, so that the scope includes the location of the substation and the excavated trench for laying the power cable trench. The application offers several recording modes.
Figure 11. Recording in the field
• Polygon
  The surface can be of any shape, it is used in 2d mapping. • Grid
  The recording surface must be square or rectangular, it is used in 2D mapping. Recording is done in one direction. • Double Grid
  The double grid must be square or rectangular, it is used in 3d models. Recording is done in two directions.
• Circular recording
  With this method of recording, a circle is placed around the object and in this way the object itself is obtained. It should be noted that this way of recording is not possible in DJI Phantom 4 rtk, because it uses its android system and in the new version of Pix4D it does not offer the possibility of circular recording. Without explanation, this option is not enabled in the new update. • Free flight
  A setting for advanced users that allows you to control the drone and freely take pictures of the object.
  In the mentioned Pix4D capture, the flight planning of the unmanned aerial vehicle was carried out. On the interactive map that was displayed after selecting the double grid method, the coverage of the measurement area for flight purposes was defined. In addition to the range, other flight parameters are also defined. The flight height of 25m and the value of the longitudinal and transverse overlap of the photos of 80% were selected. The recommended overlay value from the Pix4D manufacturer is 80%, it can be used less than 70% or even less if economy in the amount of data is needed. A larger overlay enables better quality and reconstruction, but the data collection and processing process is longer. Based on the set parameters, the program processes the necessary information, the coordinates of the spatial positions where the aircraft must take photos.


A fully autonomous recording mode was selected for the realization of the flight. Before the flight itself, the drone must be calibrated in order for the flight to be successful and check whether the memory card is set and then the command to start the mission is given, after which the mission takes place autonomously, even after the end of the mission the aircraft returns to its initial position independently.

After the recording with the drone was completed, recording with lidar technology was started on the iPhone 13 pro max. In order to enable georeferencing of recorded data, control points made of reflective material were used. The LiDAR sensor cannot detect the RGB color volume, if the camera on the iPhone is covered, it will be noticed that the data is obtained in a gray shade.
To get the center of the point when georeferencing a reflective target can be used or can be ordered on Amazon tdr 360 Retro Reflective Target as in the picture.
Spatial coordinates of reflective control points were determined by GNSS (Global navigation satellite) device RUIDE R6 Receiver with RTK method. After downloading the coordinates, the observation object was recorded with the 3D Scanner App.
The 3D Scanner App is available for use on Apple devices and can be downloaded for free from the Apple Store. The application uses the photogrammetric algorithms of 3D Scanner. The recording process is summarized in two settings that the user can adjust before recording, the 3D Voxel size and the maximum scanning depth. The voxel size of a 3D image or resolution is identical to the pixel resolution of a 2D photo. A pixel in 2D photography measures height and width, while a voxel represents height, width and depth. In a 2D image, a smaller pixel size represents a higher image quality, in a voxel, a smaller voxel size represents a deeper and more detailed scan.
Maximum scanning or Max Scanning Depth represents the maximum scanning distance that the application will take in the measurement.
The voxel size of 0.5cm is the smallest possible, and the maximum recording distance is about 5m. In the settings in the 3D Scanner App, it is necessary to set GPS Tag Scans to ON, in order to enable tagging of recordings and for the purposes of exporting data in LAS format as Geo-referenced data in EPSG 4326.
With these settings, two separate scans were required to cover the entire electrical work. Each scan is saved as a .pts file, which is a text file that records the x,y,z coordinates of each point. These .pts files represent the complete point cloud data needed for the next steps in processing the captured data. There is no such thing as a perfect camera angle. It is also recommended to take a picture every 5-10 degrees to ensure enough overlap.
After exporting the data, the data was downloaded to the computer via the OneDrive cloud service and imported into the CloudCompare software.
CloudCompare offers the ability to scale a point, two points or more. The software is easy to use. It offers to load .obj files, with a simple command File, Open, it is possible to connect textured models based on common points.
Scanned data from the iPhone and data processed from the drone in Agisoft Metashape were uploaded to Cloud Compare. In the cloud of points during georeferencing, it is necessary to see where the center of the control point is, which is made of reflective material. By manipulating the color scheme in the cloud compare, it is possible to influence the intensity of the point cloud, to decide where the center of the reflective target is. In properties, on the color scale, the scheme with blue - green - yellow - red is recommended in this case. After detecting all the control points, the georeferencing procedure follows by selecting the georeference and align tool, where the coordinates recorded by the GNSS device are entered.
The procedure was repeated with the data recorded with the UAV and processed in Metashape.
Figure 20. Georeferenced LiDAR data
Figure 21. Georeferenced UAV data

Poređenje oblaka tačaka vrši se nakon njihovog dovođenja u zajednički koordinatni sistem referentne konfiguracije. Transformacija oblaka tačaka se vrši preko odabranog skupa kodiranih referentnih tačaka. Udaljenosti između cloud – cloud se može izračunati odabirom oba oblaka, a zatim selektovanjem ikone koja se nalazi na početnom meniju. Podrazumjevani način za izračunavanje rastojanja između oblaka dvije tačke je najbliža susjedna udaljenost za svaku tačku upoređenog oblaka. Cloud compare pretražuje najbližu tačku u referentnom oblaku i izračunava njihovu udaljenost. 


DJANGO APPLICATION FOR GEOSPATIAL DATA COLLECTION

 Introduction   This paper presents a web application that was developed in the Python programming language using the Django web framework a...