Thursday 27 October 2022

Qfield application

 The first thing is to create a project in Qgis that will be synchronized to work in the Qfield android application. We create a new Shapefile Layer, adjust the name, geometry, attributive data.

After adding the layers, add the OpenStreetMap layer as a subsequent layer for the base map.

Next is the installation of the Qfield Sync plugin, for synchronizing data in .QGS format for using the Qfield android application.

Run the Package Project for Qfield function to create a project that will be imported into Qfield. The project will contain a folder that will contain .shp files with the necessary subfiles. But first, set the data in the lower left corner of Configure current project.
Podesiti Prefer offline layers and on Action Offline editing. On Layer OpenStreetMap.

Visualization is set to Default Styles.

The next thing is to set up the storage of photos so that the recorded data is connected with the spatial data. Click on the layer and select Layer Properties.

Select Attributes Form, then Photos on Widget type select Attachment.

On Path, select only Relative paths..

Integrated Document Viewer select Image.
Now it can be started on Qfield sync, Create project and we will receive a notification where the project is located in which location.
Connect the tablet to the computer via a USB cable and transfer the folder to the Qfield storage space.
Start the QField application and access the internal memory, GField storage


After data collection in the field, the data is synchronized as follows;

connect the tablet via USB to the computer, click on Synchronize from QField

Select the project in the new window..


Qfield is compatible with qgis, currently qfield cloud is not available for project synchronization, but it is expected soon. The advantage is that tasks can be prepared in advance.
Thats all, thanks for reading, Alexander


Wednesday 26 October 2022

UML model, PgModeler, database architecture

 In this blog,  i will work on database modeling, with pgModeler, i will present UML diagram.

For the purposes of system modeling, the system modeling language UML (Unified Modeling Language) was developed.

UML is a tool for visualizing, describing, building and documenting software support in the analysis and development of primarily software solutions.

Models are created in order to better understand the system because they help visualize the real or imagined system, describe its structure and behavior, represent a template by which the system can be implemented and document all the steps of building the system.

Models help the project team visualize the system being formed and allow recording various constraints on the system.

The example is presented without the use of ISO standards that follow the energy infrastructure, with the aim of showing the way of work and creating the database architecture.

PgModeler enables easy creation and editing of the database, export of formed tables in the form of SQL script, PNG image, SVG file format, HTML form or direct export to the PostgreSQL server.

In order to prevent the creation of errors or 'rules', PgModeler has a function that performs checks and in this way the database is formed without errors, with the so-called Validation function.

PgModeler enables the creation of PostGis extensions. PostGis is an extension for spatial databases and PostgreSQL. It is currently the most powerful open source tool for spatial databases. PostGis contributes to PostgreSQL several spatial data types and over 400 functions for working with those data types.

 PostGis supports many OGC/ISO SQL/MM features that you can find in other relational databases, such as Oracle, SQL Server, MySQL and IBM DB2 as well as a number of additional spatial features that are unique to PostGis.

The procedure for creating tables with the necessary columns


It is necessary to pay attention to the data type, if the data is an address or location, the data must be entered as VARCHAR (Knjaza MILosa 10c not as CHAR) or date, PostgreSQL does not recognize the date format, DATE, it must be entered under INTEGER.


In previous versions of pgModeler, it was not possible to create a PostGIS extension for importing data, tables into PostgreSQL or another database (MySQL, SQlite). The picture shows the setting for the geometric data type.

PgModeler enables an easy understanding of the architecture of the base itself, the lines between the tables are easy to see and understand. Primary and foreign keys are the starting points for visualizing the relationship, and the relationship is shown on their edges.
Constraints representing keys can be seen as pk, fk and notnull as nn, in green on the right side of each table.
Formed tables without defined relations and hierarchy and with defined relations.
Data validation during export shows that there is no Postgis extension, select Apply fixes.
Exporting the model offers options, exporting directly to the database (PostgreSQL or another database) and exporting in sql format, which we can later import into the database or work on the tables later.
Editing the connection with the postgreSQL database and testing the connection.
The database was successfully imported, when checking in PostgreSQL, you must refresh the database to display the data.

Thats all. If you work with database, its only routine with modeling. See you.. 


Sunday 23 October 2022

sql querry in postgresql database

 All the spatial data imported into our tables are not very useful if we do not have the appropriate tools needed to use and extract the necessary information from it. Spatial queries provide a way to process a huge number of records in a very short time.

Nowadays, almost every domain of business, whether it is small online stores or large corporations, uses data. This data is managed using databases. This is why database administrators, especially those with knowledge of SQL databases, are in high demand.

Data is at the core of many web and mobile applications. For example, an application like Facebook contains information about the user, his friends, posts, etc. Databases are used to store this data. SQL is a programming language that allows developers to manipulate that data.

The abbreviation SQL refers to Structured Query Language, i.e. structured query language.

According to the W3School definition: "SQL is a standard language for storing, managing and retrieving data in databases".

Basically, it is a language that allows communication with databases and management of all the data they contain

The concept of SQL was first developed in the 1970s by Edgar F. Codd, a pioneer in relational database management. He wanted to create a system that would facilitate the management of shared databases. IBM engineers Donald D. Chamberlin and Raymond F. Boyce accepted the theory behind Codd's research and began developing the concept, using it to search for information in System R, the company's semi-relational database.

IBM continued to develop the technology and initially called SQL SEQUEL (Structured English Query Language), and in 1979 Oracle (then called Relational Software) released the first commercial version of the system. SEQUEL was later renamed SQL, as SEQUEL was a trademark of the British company Hawker Siddeley Dynamics Engineering Limited.

This programming language has various uses in the field of data analysis, and is particularly useful because it can:

• - Execute queries against the database

• - Retrieves data from the database

• - Updates records in the database

• - Deletes records from the database

• - Creates new databases, or new tables in the database

• - Creates save and review procedures in the database


Example of a query for the length of the 110 kV transmission line of Elektrokrajine Elektrodistrbutivni predusje. For geometric data types, returns the 2D Cartesian length of the geometry if the data is Linestring, MultiLineString, St_Curve, ST_MultiCurve. Length units are in meters.

Query for streets with only one substation. In this query, you can notice the use of the JOIN clause, which combines the joining of tables, their rows and data. In SQL queries, fields are always grouped first with the group by command, after which the having command is withdrawn. Finally, count the necessary data with the count command.
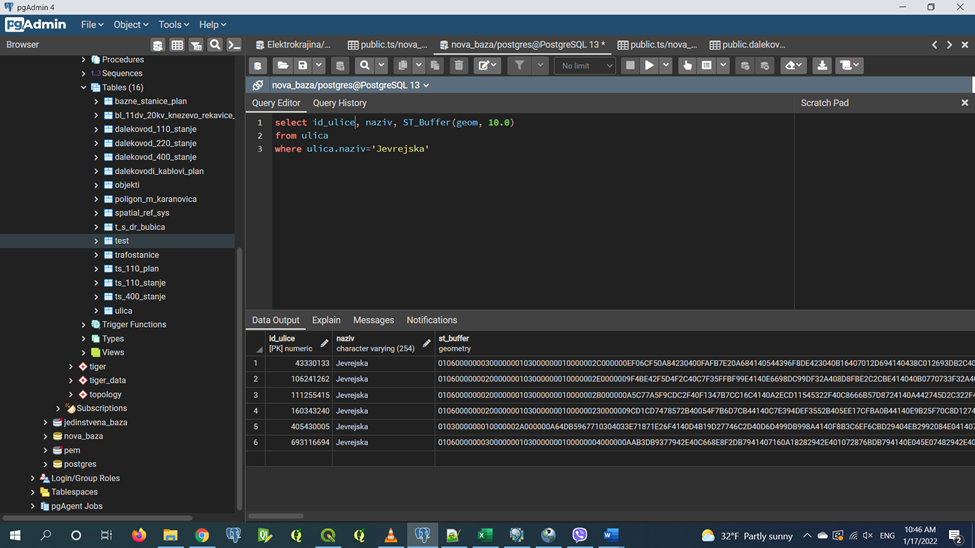
The ST_Buffer function encircles a geometric object at a specified distance and returns a geometric object that is a buffer that surrounds the original object. In this example, we are looking for data on which substations are located in Jevrejska Street.

A separate number of substations for each street.
The ST_Distance function calculates the shortest distance between two geometries. In this task, the cross join command is used, which combines each row from the first set of rows with each row from the second set of rows. This command is used when a normal connection cannot be used. In this task, it is very important that the data type is not recorded as geometry, but geography, due to the accuracy of the data and the mathematical way of calculating the data.
Example query to compare distances between geometries and compare results with Web Merkator distances. In the spwgs84 column, the Spheroidal distance was calculated, which was compared with the WM distance. As you can see, the distance is different, the spheroid is better for measuring.

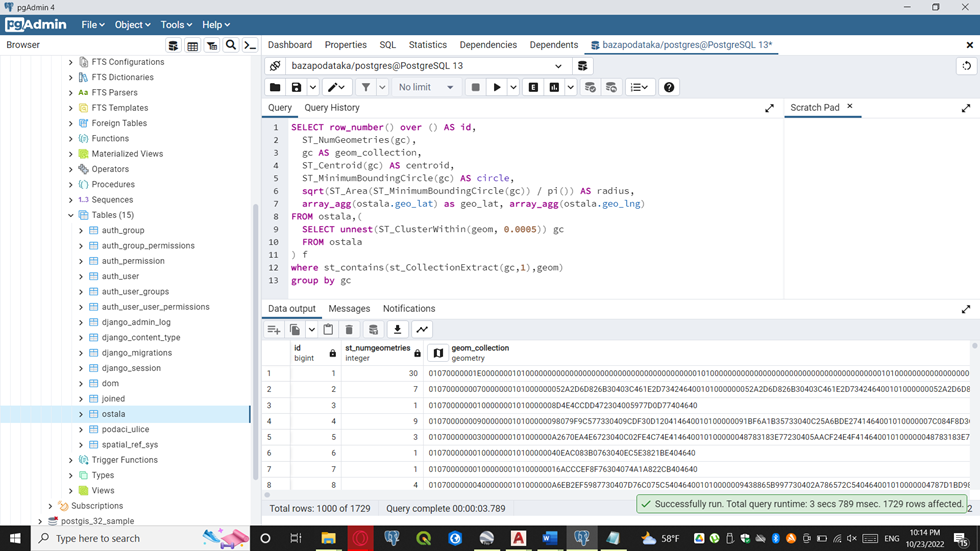
Sample for clustering data with postgis function. Data was points with coordinates lat and long, i want to cluster groups of data with same position. We have two ways to do that.

First way with postgis functions and form cluster in radius,
Second way is clean sql, where is not used postgis functions to form cluster of points with identical coordinates. In clean sql we cant calculate radius of points or dimension of polygons to determinate our groups.


Data migrations, postgresql, postgis extension

 PostgreSQL is a business-class relational database management system, on par with the best commercial database systems such as Oracle, MicrosoftSQL Server and IBM DB2. PostgreSQL is special because it's not just a database, it's also an application platform, and it's impressive at that. PostgreSQL is fast to work with, in Benchmarks PostgreSQL either exceeds or matches the performance of many other databases, both open source and proprietary.

One of the most important advantages of PostgreSQL is that it is open source, which means that you have a license to install, use and distribute PostgreSQL without paying anyone a fee or copyright. Additionally, PostgreSQL is well known as a database that remains operational for long periods of time and requires little or no maintenance.

What surprises many people is that PostgreSQL's feature set is more comparable to Oracle or SQL Server than it is to MySQL. The only connection between MySQL and PostgreSQL is that these two databases are open source, apart from that the features and philosophies are almost completely different.

Who uses PostgreSQL? Famous users include

 Apple, BASF, IMDB.com, SKYPE, Yahoo and many others. Over a million downloads per year according to the data provided. When PostgreSQL was first developed, it was named Postgres, and many aspects of the project still refer to the word 'postgres'. For example, the default database is called postgres, and software is often installed using the postgres username. as a result, people shorten the name PostgreSQL to simply Postgres.

Postgis extension


PostGis is an extension or extension for the spatial database Postgresql open source database management system. It is currently the most powerful open source spatial database system. PostGis adds to Postgresql several spatial data types and over 400 functions to work with those spatial data types.

In the database that we form, we simply create the query create extension postgis, after which a new table will appear in the left browser.


Before we continue, it is necessary to explain the spatial table. The spatial table has a field of a special type called geometry, this is a data type that allows us to store geographic data and it is available only after a spatial extension has been created in our database. There is another type of geographic data called geography, it is mainly used to obtain greater accuracy in measurements over long distances. The problem here is that it uses more complex math and has fewer spatial functions that accept this data type as a parameter.
So, what does the spatial database offer us:
It provides the ability to easily mix spatial data with other corporate data, such as financial information, observation data and marketing information. We can do this with Esri shapefiles, KML files and other GiS file formats.
A database such as Postgresql has features such as a query scheduler that improves the speed of your joins and many commonly used statistical functions for building complex queries.
While many think of PostGis as a Geographic Information System tool, as the name implies, we see it as a tool for spatial analysis. The difference is that while geography focuses on the earth and the reference system that binds the earth, spatial analysis focuses on space and the use of space.
After setting the data in Qgis, we will save the data in SHP format > Export > Save feature As > Save Vector Layer As and select Esri Shapefile.


PostGIS comes bundled with a pair of command-line tools, shp2pgsql and pgsql2shp, for importing and exporting Esri shapefiles. The GUI version is shp2pgsql gui. The gui version imports and exports data.

After saving the data in .shp format, the first thing you do is connect postgis to the postgresql database. Enter the username and password you chose during installation. Localhost is 5432 by default, of course you must enter the name of the database you have in postgresql.


SRID is short for spatial reference identifier and is an integer that refers to the primary key of the spatial_ref_sys table. PostGIS uses this table to catalog all spatial reference systems available to the database. The spatial_ref_sys table contains the name of the spatial reference system (SRS), the parameters needed to reproject from one SRID to another, and the organization that led to the particular SRID. It should be kept in mind that a similar term in GIS jargon is called SRS ID (spatial reference system identifier). This identifier adds the authority created by the SRID.
For example, the common WGS 84 lon/lat has an SRID of 4326 but an SRS ID of EPSG:4326, where EPSG stands for European Petroleum Survey Group (www.epsg.org). Most SRIDs in PostGIS come from EPSG, so the SRID used in the table according to PostGIS convention is the same as the EPSG identifier.
In postgis, double-click SRID to enter the SRID, postgresql will not display the data correctly if this parameter is not set.
Now we have spatial tables, one with data on substations (Figure 30), represented as a PostGis Point type, the other with streets.
After importing the data, it is necessary to refresh the database in order to display the data. An important note is that in the PostGis settings, we only show the incoming SRID, we do not perform any transformation.


Loading of data and formation of bases layer for buffering of data

The term background usually refers to data that we are not the authors of, and we use them to help us in our work, research, processing or publication of data. Most often, we are talking about raster bases in the form of topographic maps, surface models (DEM), pedological maps and various spatial data (borders of states, municipalities) intended for easier finding or processing and visualization of author's data.


OSM map data can be downloaded at once for all vector layers via the website extract.bbbike.org. Also, the data that has been loaded should be saved in the EPSG:4326 projection (Export → Save Features as and the Shapefile data type can be selected). There is a possibility of downloading data through the QuickOSM plugin, available in QGIS, but for this work it was not possible because a smaller area can be downloaded from the OSM map, while bbbike.org offers the possibility of downloading larger territories, states.


Other data that will be used were collected in the field through the input application and merge service, which was explained in the previous blog. We will use substation coordinates and certain attributive data for data.
The buffer tool is often used in QGIS, which produces a new vector polygon layer, representing a certain distance from the input features. It can be used to identify proximity to certain features.


In this step, a buffer zone is created around the streets in the Banja Luka area at a distance of 10m in accordance with the defined substation coordinates. The option Vector → Geoprocessing Tools → Buffer is used to define the buffer zone. In addition to this option, there is also a related Variable width buffer option that is used when it is necessary to define a buffer zone of different width for different entities. Then the M value is taken as the distance value, which usually represents the temporal dimension of an entity (in addition to the spatial coordinates X, Y and Z)
In the window for setting buffer parameters, it is necessary to set the input file over which the buffer is created (Input layer), the distance value (Distance) and the output file (Buffer). If the Open output file after running algorithm box is checked, the resulting layer will be automatically loaded into the current project. Enter 0.00010 for the value of the band around the track, leave the Dissolve result option enabled so that the layer is merged in the form of a buffer polygon, and leave the other settings at the default values. The resulting layer needs to be adjusted to the appropriate coordinate system.


Spatial association is a spatial analysis where, based on the location, the attributes of entities of one layer that are in some relationship with the entity of another layer can be aggregated. The Join attributes by location (summary) function is located in the Vector general Processing Toolbox command group. Here you can determine the total number of substations (points) that fall into the buffer route, the sum of all substations, etc. It is important to first select the layer within which the buffer is located and then the ts from which the attribute values will be aggregated.


It is possible to specify which attributes will be used for the calculation - by clicking on Join type, take attributes of the first matching feature only (one-to-one) attributive data will not be duplicated, which would prevent the operation of the database. As a result, a new layer is obtained that contains newly generated attributes with a summary of attribute values by individual statistics.


DJANGO APPLICATION FOR GEOSPATIAL DATA COLLECTION

 Introduction   This paper presents a web application that was developed in the Python programming language using the Django web framework a...